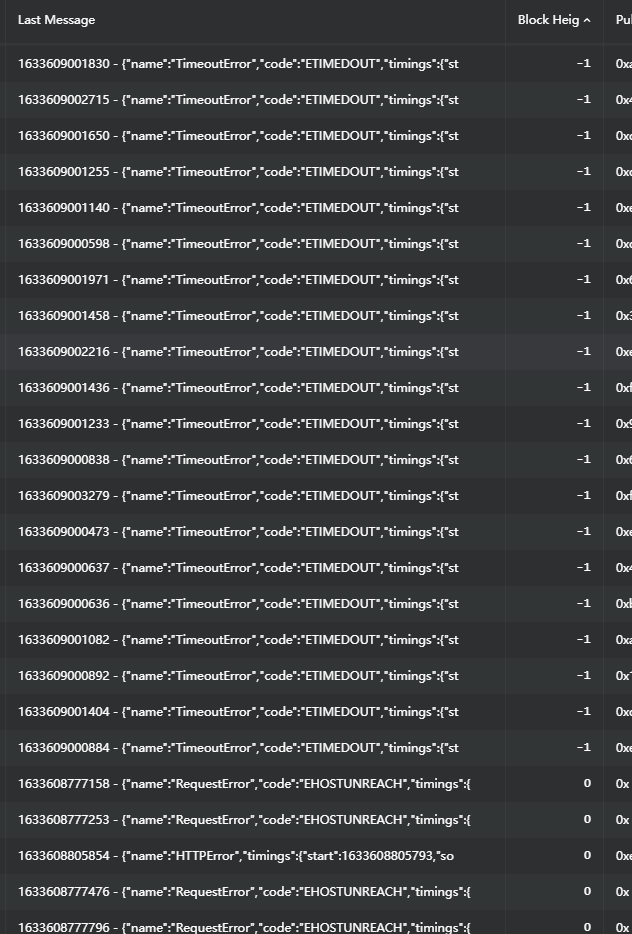
【问题】控制台提示超时,重启无数次,使用了最新镜像,pruntime进程在
1633436893663 - {“name”:“TimeoutError”,“code”:“ETIMEDOUT”,“timings”:{“start”:1633436863663,“socket”:1633436863663,“lookup”:1633436863664,“connect”:1633436863664,“error”:1633436893663,“phases”:{“wait”:0,“dns”:1,“tcp”:0,“total”:30000}},“event”:“request”,“message”:“Timeout awaiting ‘request’ for 30000ms”,“stack”:“RequestError: Timeout awaiting ‘request’ for 30000ms\n at ClientRequest. (/opt/app/node_modules/.pnpm/[email protected] /node_modules/got/dist/source/core/index.js:956:65)\n at Object.onceWrapper (events.js:520:26)\n at ClientRequest.emit (events.js:412:35)\n at ClientRequest.origin.emit (/opt/app/node_modules/.pnpm/@[email protected] /node_modules/@szmarczak /http-timer/dist/source/index.js:43:20)\n at Socket.socketErrorListener (_http_client.js:475:9)\n at Socket.emit (events.js:412:35)\n at emitErrorNT (internal/streams/destroy.js:106:8)\n at emitErrorCloseNT (internal/streams/destroy.js:74:3)\n at processTicksAndRejections (internal/process/task_queues.js:82:21)\n at Timeout.timeoutHandler [as _onTimeout] (/opt/app/node_modules/.pnpm/[email protected] /node_modules/got/dist/source/core/utils/timed-out.js:36:25)\n at listOnTimeout (internal/timers.js:559:11)\n at processTimers (internal/timers.js:500:7)”}
zzz
October 5, 2021, 12:43pm
4
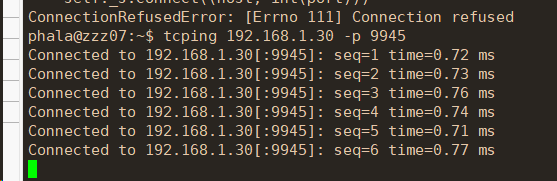
tcping host -p 端口看看,9444 9445 在work上ping node试试
zzz
October 6, 2021, 1:06am
6
没看到结果啊,哈。10是内网ip ,不打码也没事。
lifecycle启动后,挂了,提示如下错误:
events.js:377
throw er; // Unhandled 'error' event
^
RequestError: write EPIPE
at ClientRequest.<anonymous> (/opt/app/node_modules/.pnpm/[email protected] /node_modules/got/dist/source/core/index.js:956:111)
at Object.onceWrapper (events.js:520:26)
at ClientRequest.emit (events.js:412:35)
at ClientRequest.origin.emit (/opt/app/node_modules/.pnpm/@[email protected] /node_modules/@szmarczak/http-timer/dist/source/index.js:43:20)
at Socket.socketErrorListener (_http_client.js:475:9)
at Socket.emit (events.js:412:35)
at emitErrorNT (internal/streams/destroy.js:106:8)
at emitErrorCloseNT (internal/streams/destroy.js:74:3)
at processTicksAndRejections (internal/process/task_queues.js:82:21)
at WriteWrap.onWriteComplete [as oncomplete] (internal/stream_base_commons.js:94:16)
Emitted 'error' event on Request instance at:
at emitErrorNT (internal/streams/destroy.js:106:8)
at emitErrorCloseNT (internal/streams/destroy.js:74:3)
at processTicksAndRejections (internal/process/task_queues.js:82:21) {
code: 'EPIPE',
timings: {
start: 1633522856113,
socket: 1633522856113,
lookup: 1633522857116,
connect: 1633522857116,
secureConnect: undefined,
upload: 1633522872125,
response: 1633522872124,
end: undefined,
error: 1633522872125,
abort: undefined,
phases: {
wait: 0,
dns: 1003,
tcp: 0,
tls: undefined,
request: 15009,
firstByte: NaN,
download: undefined,
total: 16012
}
}
}
ELIFECYCLE Command failed with exit code 1.
zzz
October 6, 2021, 2:56pm
10
你是用docker 启动的lifecycle ?感觉是什么链接没有连上
docker,不清楚EPIPE是什么东西,应该和socket有关系。启动时,同步完了1分钟才挂。
{"name":"prb","hostname":"lifecycle","pid":18,"level":40,"retryCount":1,"url":"http://10.0.23.5:8000/prpc/PhactoryAPI.GetInfo","msg":"RequestError: socket hang up\n at ClientRequest.<anonymous> (/opt/app/node_modules/.pnpm/[email protected] /node_modules/got/dist/source/core/index.js:956:111)\n at Object.onceWrapper (events.js:520:26)\n at ClientRequest.emit (events.js:412:35)\n at ClientRequest.origin.emit (/opt/app/node_modules/.pnpm/@[email protected] /node_modules/@szmarczak/http-timer/dist/source/index.js:43:20)\n at Socket.socketOnEnd (_http_client.js:499:9)\n at Socket.emit (events.js:412:35)\n at endReadableNT (internal/streams/readable.js:1317:12)\n at connResetException (internal/errors.js:628:14)\n at Socket.socketOnEnd (_http_client.js:499:23)\n at Socket.emit (events.js:412:35)\n at endReadableNT (internal/streams/readable.js:1317:12)\n at processTicksAndRejections (internal/process/task_queues.js:82:21) {\n code: 'ECONNRESET',\n timings: {\n start: 1633573235643,\n socket: 1633573235643,\n lookup: 1633573235648,\n connect: 1633573235648,\n secureConnect: undefined,\n upload: 1633573235648,\n response: undefined,\n end: undefined,\n error: 1633573241636,\n abort: undefined,\n phases: {\n wait: 0,\n dns: 5,\n tcp: 0,\n tls: undefined,\n request: 0,\n firstByte: undefined,\n download: undefined,\n total: 5993\n }\n }\n}","time":"2021-10-07T02:20:42.649Z","v":0}
wowvwow
October 7, 2021, 12:26pm
13
今天更新node,prb,pruntime后,同样的报错
官方能有个及时回复的人不
1633619004398 - {“payload”:{“message”:“BlockNumberMismatch”},“signature”:“c86eea8ce246a08172c6d8b670e9057784df9de92c592a0297a2722f73696f4cbbecb3c56781d256508080dac7f2ec9241b5bd7884a222e5259e282447253584”,“status”:“error”,“isRuntimeReturnedError”:true}
既有机器报错BlockNumberMismatch,卡高度不动
还有个现象,今天prb未更新前,将原来的solo模式的pruntime切换到prb后,能直接同步完高度,到stakepool中,直接是自动开始挖矿
卡高度不动:
重要公告:请升级Khala节点至v0.1.5 (Kusama v0.9.10)️
pruntime设置超时时间看看
version: "3"
services:
  pruntime:
    image: phalanetwork/phala-pruntime
    container_name: pruntime
    restart: always
    hostname: pruntime
    environment:
      - "ENABLE_KICK_API=1"
      - ROCKET_KEEP_ALIVE=300
      - ROCKET_READ_TIMEOUT=300
      - ROCKET_WRITE_TIMEOUT=300
    volumes:
      - "./data:/root/data"
    devices:
      - "/dev/sgx/enclave:/dev/sgx/enclave"
      - "/dev/sgx/provision:/dev/sgx/provision"
    ports:
      - "8000:8000"
@suugee 问题没有解决哦。我问的问题,官方就没有帮我解决过。
suugee
October 8, 2021, 7:01am
20
prb问题在开发者板块跟帖或者单独一个贴总结发吧。